cdxcore.dynaplot#
Tools for dynamic plotting in Jupyer/IPython.
The aim of the toolkit is making it easier to develop
animated visualization with matplotlib,
for example during training with machine learing kits such as
pyTorch.
It also makes the creation of subplots more streamlined.
This has been tested with Anaconda’s
JupyterHub and %matplotlib inline.
Overview#
Animated Graphs, Simple#
The package now contains a lazy method to manage updates to graphs (animations). This is implemented as follows:
Create a figure with
cdxcore.dynaplot.figure(). Then callcdxcore.dynaplot.DynaFig.store()to return an “element store”.When creating new matplotlib elements such as plots, figures, fills, lines, add them to the store with
store +=. Do not add elements you wish to retain (for example legends if the dictionary of plots stays the same between updates).Call
cdxcore.dynaplot.DynaFig.render()to render all graphical elements. Do not callcdxcore.dynaplot.DynaFig.close().To update your elements (i.e. animation) call
cdxcore.dynaplot.FigStore.remove()to remove all old graphical elements (this function callsmatplotlib.axes.Axes.remove()).Then re-create the cleared elements, and call
cdxcore.dynaplot.DynaFig.render()again.When your animation is finished, call
cdxcore.dynaplot.DynaFig.close().If you do not call close, you will likely see unwanted copies of your plots in Jupyter.
If possible, use the
with figure(...) as figpattern which will ennsure thatcdxcore.dynaplot.DynaFig.close()is called.
Here is an example of animated line plots using cdxcore.dynaplot.DynaFig.store():
%matplotlib inline
import numpy as np
import time
from cdxcore.dynaplot import figure, MODE

x  = np.linspace(0,1,100)
pm = 0.2

with figure(col_size=10) as fig:
    ax  = fig.add_subplot()
    ax2 = fig.add_subplot()
    ax2.sharey(ax)
    store = fig.store()
    fig.render()

    for i in range(10):
        y = np.random.random(size=(100,))
        ax.set_title(f"Test {i}")
        ax2.set_title(f"Test {i}")

        store.remove() # delete all prviously stored elements
        store += ax.plot(x,y,":", label=f"data {i}")
        store += ax2.plot(x,y,"-",color="red", label=f"data {i}")
        store += ax2.fill_between( x, y-pm, y+pm, color="blue", alpha=0.2 )
        store += ax.legend()

        fig.render()
        time.sleep(0.5)

In above example we used the with context of a cdxcore.dynaplot.DynaFig figure.
The point of using with where convenient is that it will call cdxcore.dynaplot.DynaFig.close()
which will avoid duplicate copies of the figure in jupyter.
To do close the figure manually, call cdxcore.dynaplot.DynaFig.close() directy:
 %matplotlib inline
 import numpy as np
 import time
 from cdxcore.dynaplot import figure, MODE

 x  = np.linspace(0,1,100)
 pm = 0.2

 fig = figure(col_size=10)
 ax  = fig.add_subplot()
 ax2 = fig.add_subplot()
 ax2.sharey(ax)
 store = fig.store()
 fig.render()

 for i in range(10):
     y = np.random.random(size=(100,))
     ax.set_title(f"Test {i}")
     ax2.set_title(f"Test {i}")

     store.remove() # delete all prviously stored elements
     store += ax.plot(x,y,":", label=f"data {i}")
     store += ax2.plot(x,y,"-",color="red", label=f"data {i}")
     store += ax2.fill_between( x, y-pm, y+pm, color="blue", alpha=0.2 )
     store += ax.legend()

     fig.render()
     time.sleep(0.5)

 fig.close()
Here is an example with
animated 3D plots, calling matplotlib.axes.Axes.remove() manually:
%matplotlib inline
import numpy as np
from cdxcore.dynaplot import figure
import math

x = np.linspace(0.,2.*math.pi,51)
y = x

with figure() as fig:
    ax1  = fig.add_subplot(projection='3d')
    ax2  = fig.add_subplot(projection='3d')
    ax1.set_xlim(0.,2.*math.pi)
    ax1.set_ylim(0.,2.*math.pi)
    ax1.set_zlim(-2,+2)
    ax1.set_title("Color specified")
    ax2.set_xlim(0.,2.*math.pi)
    ax2.set_ylim(0.,2.*math.pi)
    ax2.set_zlim(-2,+2)
    ax2.set_title("Color not specified")
    fig.render()
    r1 = None
    r2 = None
    import time
    for i in range(50):
        time.sleep(0.01)
        z = np.cos( float(i)/10.+x )+np.sin( float(i)/2.+y )
        if not r1 is None: r1.remove()
        if not r2 is None: r2.remove()
        r1 = ax1.scatter( x,y,z, color="blue" )
        r2 = ax2.scatter( 2.*math.pi-x,math.pi*(1.+np.sin( float(i)/2.+y )),z )
        fig.render()
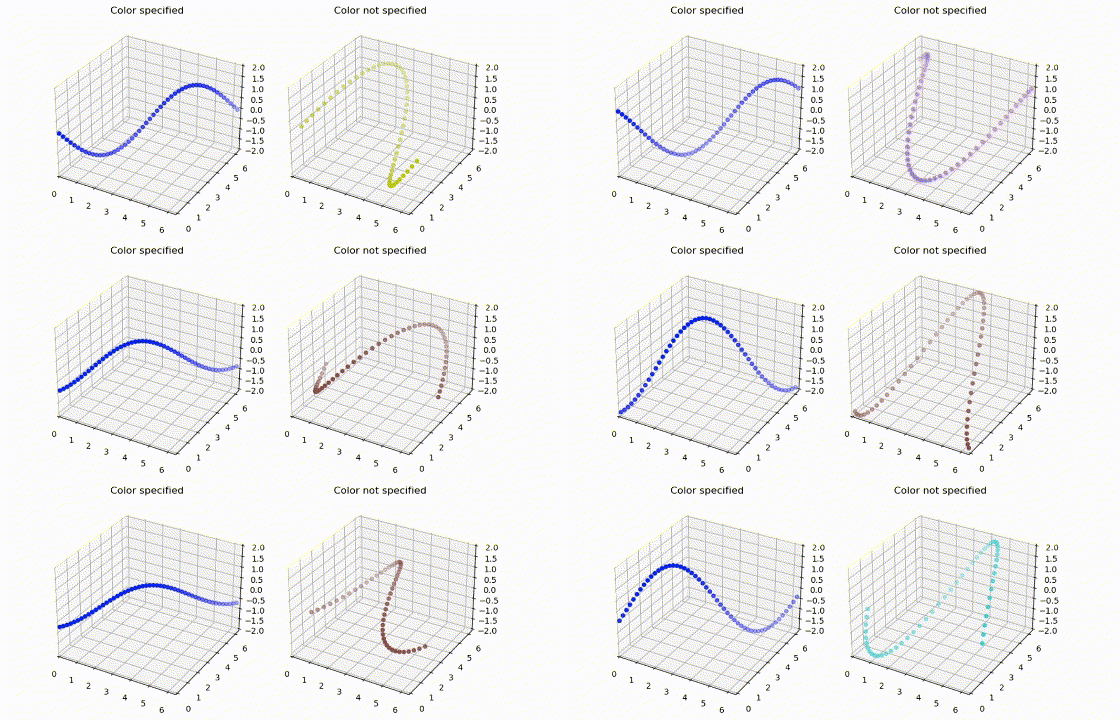
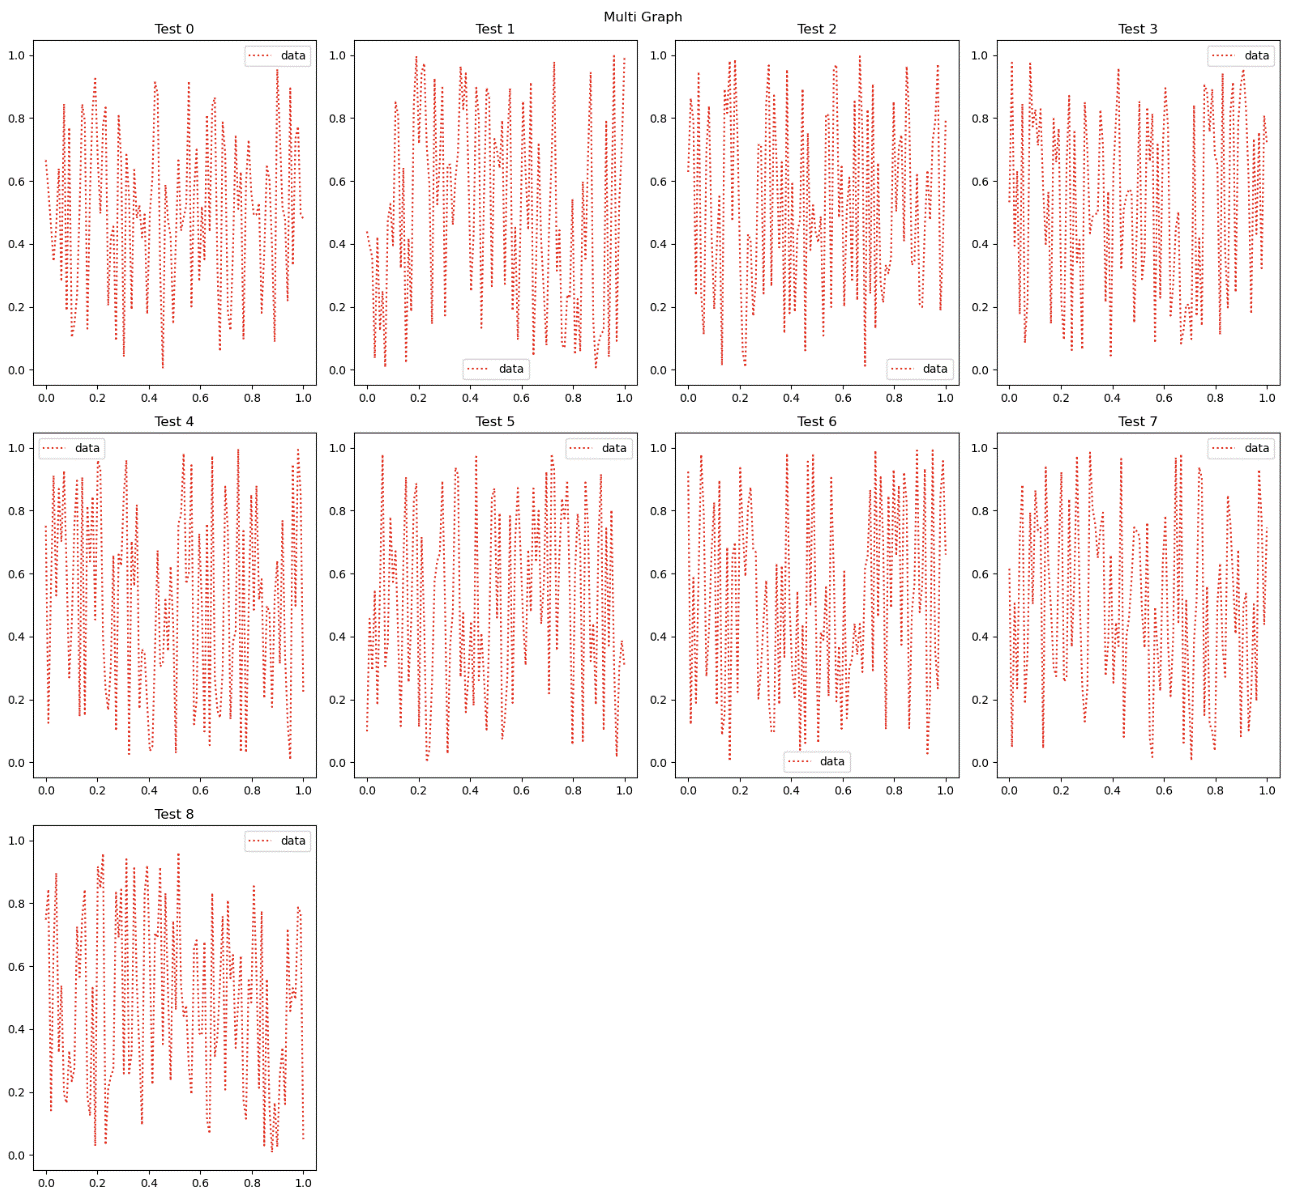
The jupyter notebook contains a few more examples.
Simpler sub_plot#
The package lets you create sub plots without having to know the number of plots in advance.
You have the following two main
options when creating a new cdxcore.dynaplot.figure():
Define as usual
figsize, and specify the number ofcolumns. In this case the figure will arrange plots you add withcdxcore.dynaplot.DynaFig.add_subplot()iteratively with at mostcolumnsplots per row.add_subplot()will not need any additional positional arguments.Instead, you can specify
col_size,row_size, andcolumns: the first two define the size per subplot. Like before you then add your sub plots usingcdxcore.dynaplot.DynaFig.add_subplot()without any additional positioning arguments.Assuming you add N subplots, then the overall
figsizewill be(col_size* (N%col_num), row_size (N//col_num)).
When adding plots with cdxcore.dynaplot.DynaFig.add_subplot() you can
make it skip to the first column in the next row,
by calling cdxcore.dynaplot.DynaFig.next_row().
The example also shows that we can specify titles for subplots and figures easily:
%matplotlib inline
import numpy as np
import time
from cdxcore.dynaplot import figure

x = np.linspace(0,1,100)

with figure(title="Multi Graph", fig_size=(10,6), columns=4) as fig:
    lines  = []
    ref_ax = None
    for k in range(9):
        ax = fig.add_subplot()
        ax.set_title("Test %ld" % k)
        y = np.random.random(size=(100,1))
        l = ax.plot(x,y,":",color="red", label="data")
        lines.append(l)
        ax.legend()

        if not ref_ax is None:
            ax.sharey(ref_ax)
            ax.sharex(ref_ax)
        else:
            ref_ax = ax
    fig.render()

    for i in range(5):
        time.sleep(0.2)
        for l in lines:
            y = np.random.random(size=(100,1))
            l[0].set_ydata( y )
        fig.render()
Grid Spec#
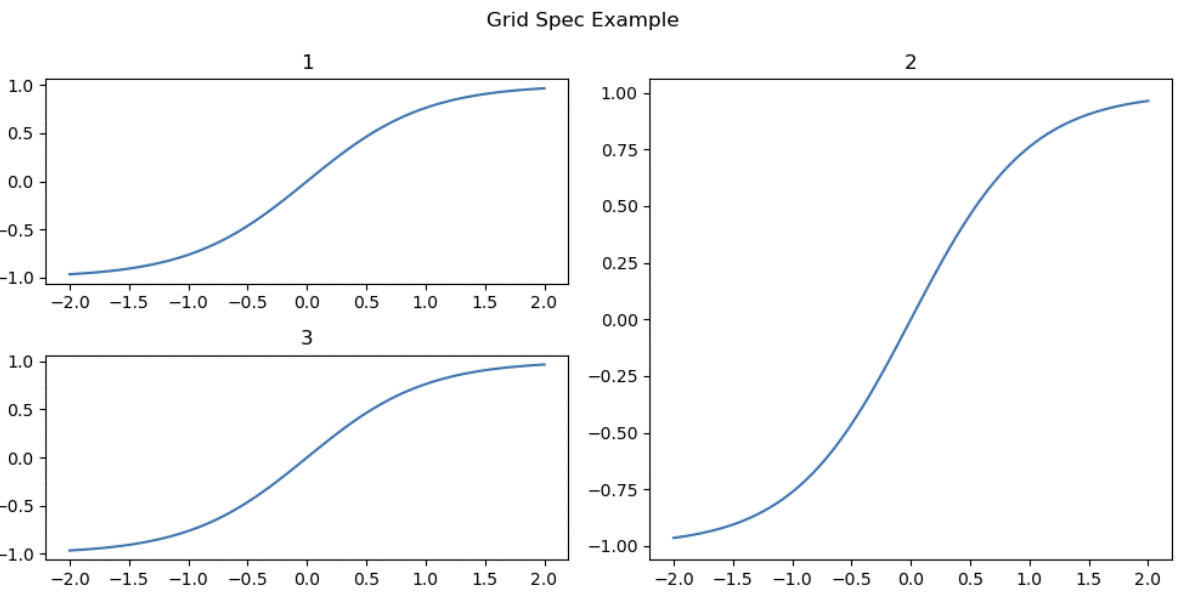
Another method to place plots is by explicitly positioning them using
a matplotlib.gridspec.GridSpec. In line with the paradigm
of delayed creation, use cdxcore.dynaplot.DynaFig.add_gridspec()
to generate a deferred grid spec.
Example:
%matplotlib inline
from cdxcore.dynaplot import figure
import numpy as np

x = np.linspace(-2.,+2,21)

with figure(tight=False) as fig:
    ax = fig.add_subplot()
    ax.plot( x, np.sin(x) )
    fig.render()

    ax = fig.add_axes( (0.5,0.5,0.3,0.3), "axes" )
    ax.plot( x, np.cos(x) )
Color Management#
Use cdxcore.dynaplot.color_css4(), cdxcore.dynaplot.color_base(), cdxcore.dynaplot.color_tableau(), cdxcore.dynaplot.color_xkcd()
to return an i th element of the respective matplotlib color
table.
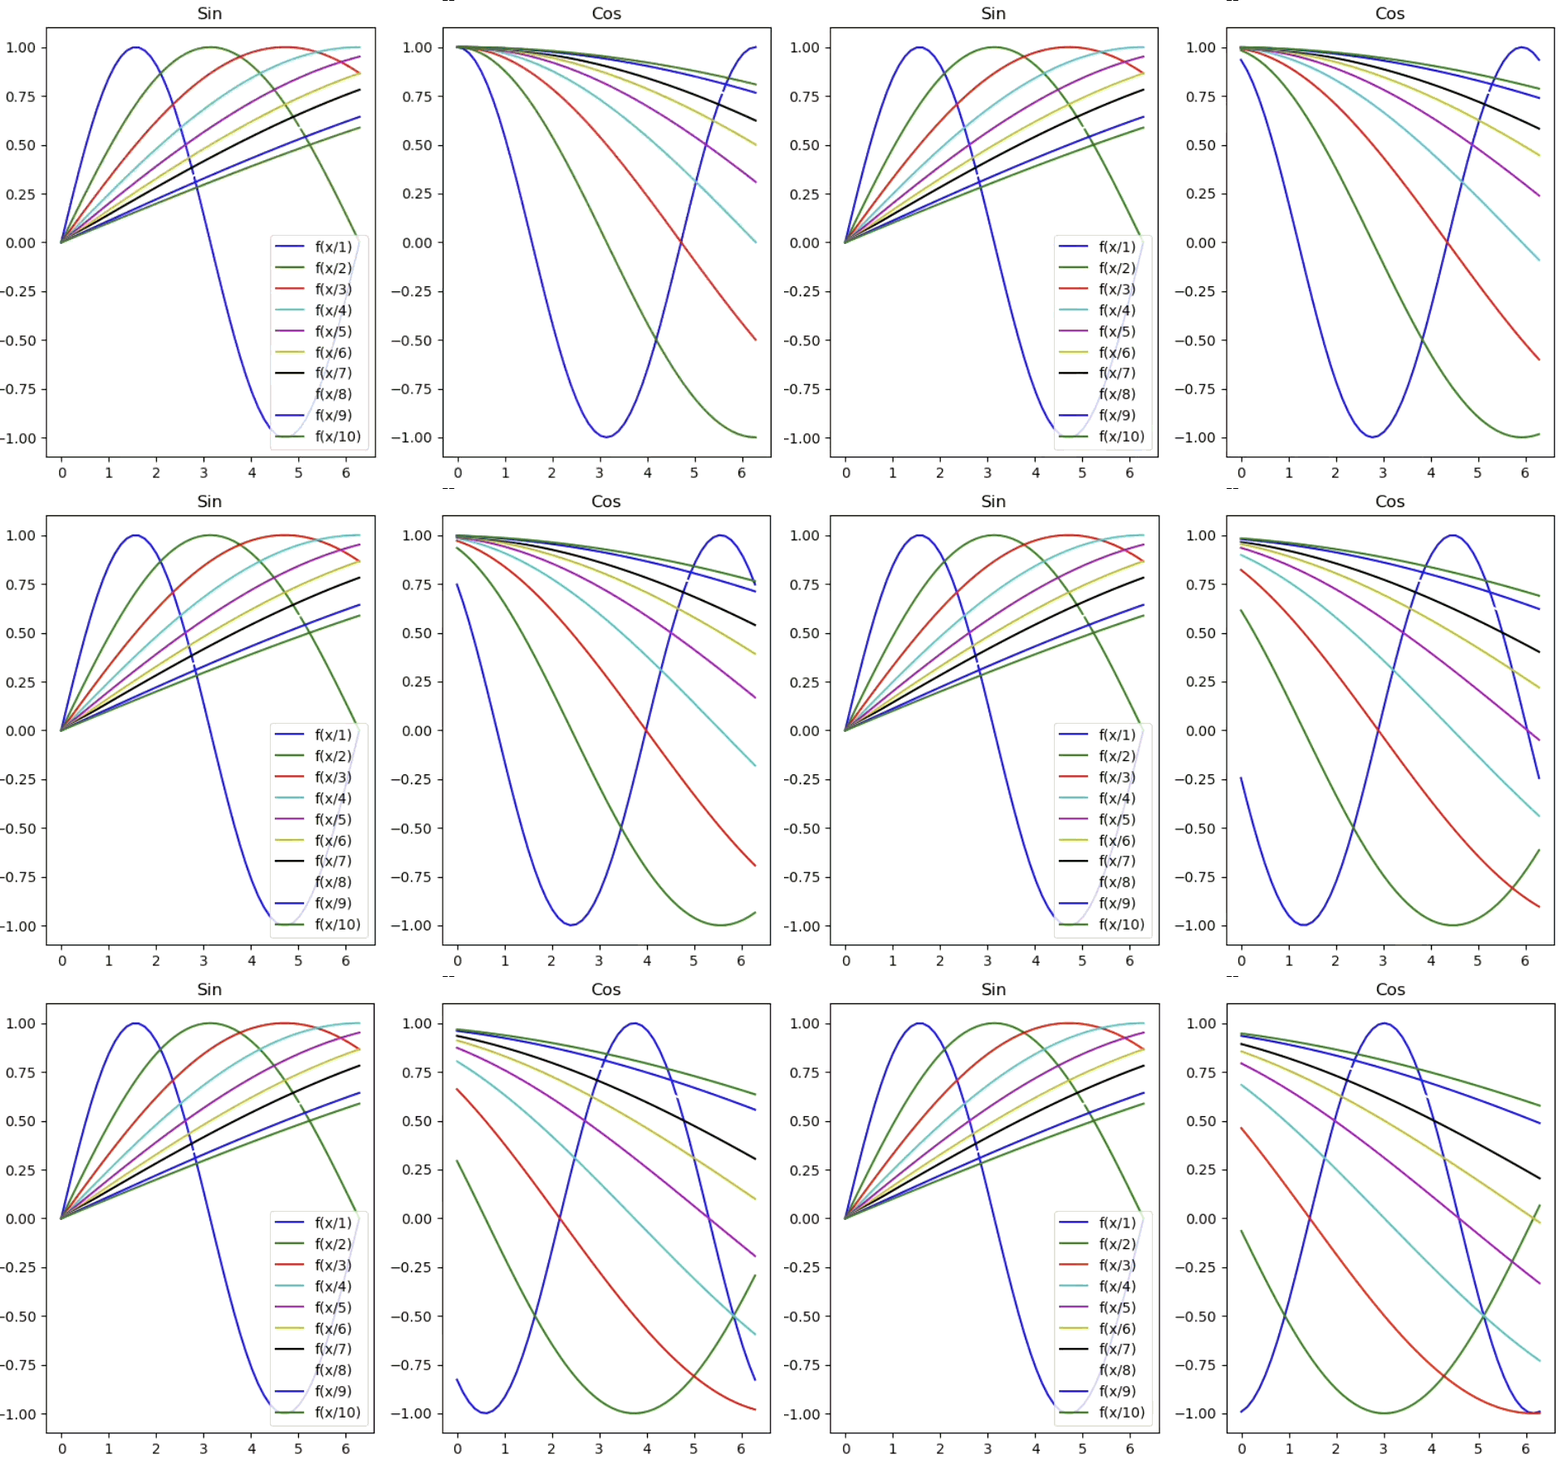
This simplifies using consistent colors accross different plots or when re-creating plots during an animation.
Example of using the same colors by order in two plots:
%matplotlib inline
import numpy as np
import math
import time
from cdxcore.dynaplot import figure, color_base   # 'figure' is an alias for DynaFig

x = np.linspace(0.,2.*math.pi,51)

with figure(fig_size=(14,6)) as fig:
    ax = fig.add_subplot("Sin")
    store = fig.store()
    # draw 10 lines in the first sub plot, and add a legend
    for i in range(10):
        y = np.sin(x/(i+1))
        ax.plot( x, y, color=color_base(i), label=f"f(x/{i+1})" )
    ax.legend(loc="lower right")

    # draw 10 lines in the second sub plot.
    # use the same colors for the same scaling of 'x'
    ax = fig.add_subplot("Cos")

    for i in range(10):
        z = np.cos(x/(i+1))
        store += ax.plot( x, z, color=color_base(i) )
    fig.render()

    # animiate, again with the same colors
    for p in np.linspace(0.,4.,11,endpoint=False):
        time.sleep(0.1)
        store.clear() # alias for 'remove'
        for i in range(10):
            z = np.cos((x+p)/(i+1))
            store += ax.plot( x, z, color=color_base(i) )
        fig.render()
Here is a view of the first 20 colors of the four supported maps, computed with:
%matplotlib inline
from cdxcore.dynaplot import figure, color_names, color
import numpy as np
x = np.linspace(-2.*np.pi,+2*np.pi,101)
N = 20
with figure(f"Color tables up to #{N}", figsize=(20,15), columns=2) as fig:
    for color_name in color_names:
        ax  = fig.add_subplot(color_name)
        for i in range(N):
            r =1./(i+1)
            ax.plot( x, np.sin(x*r), color
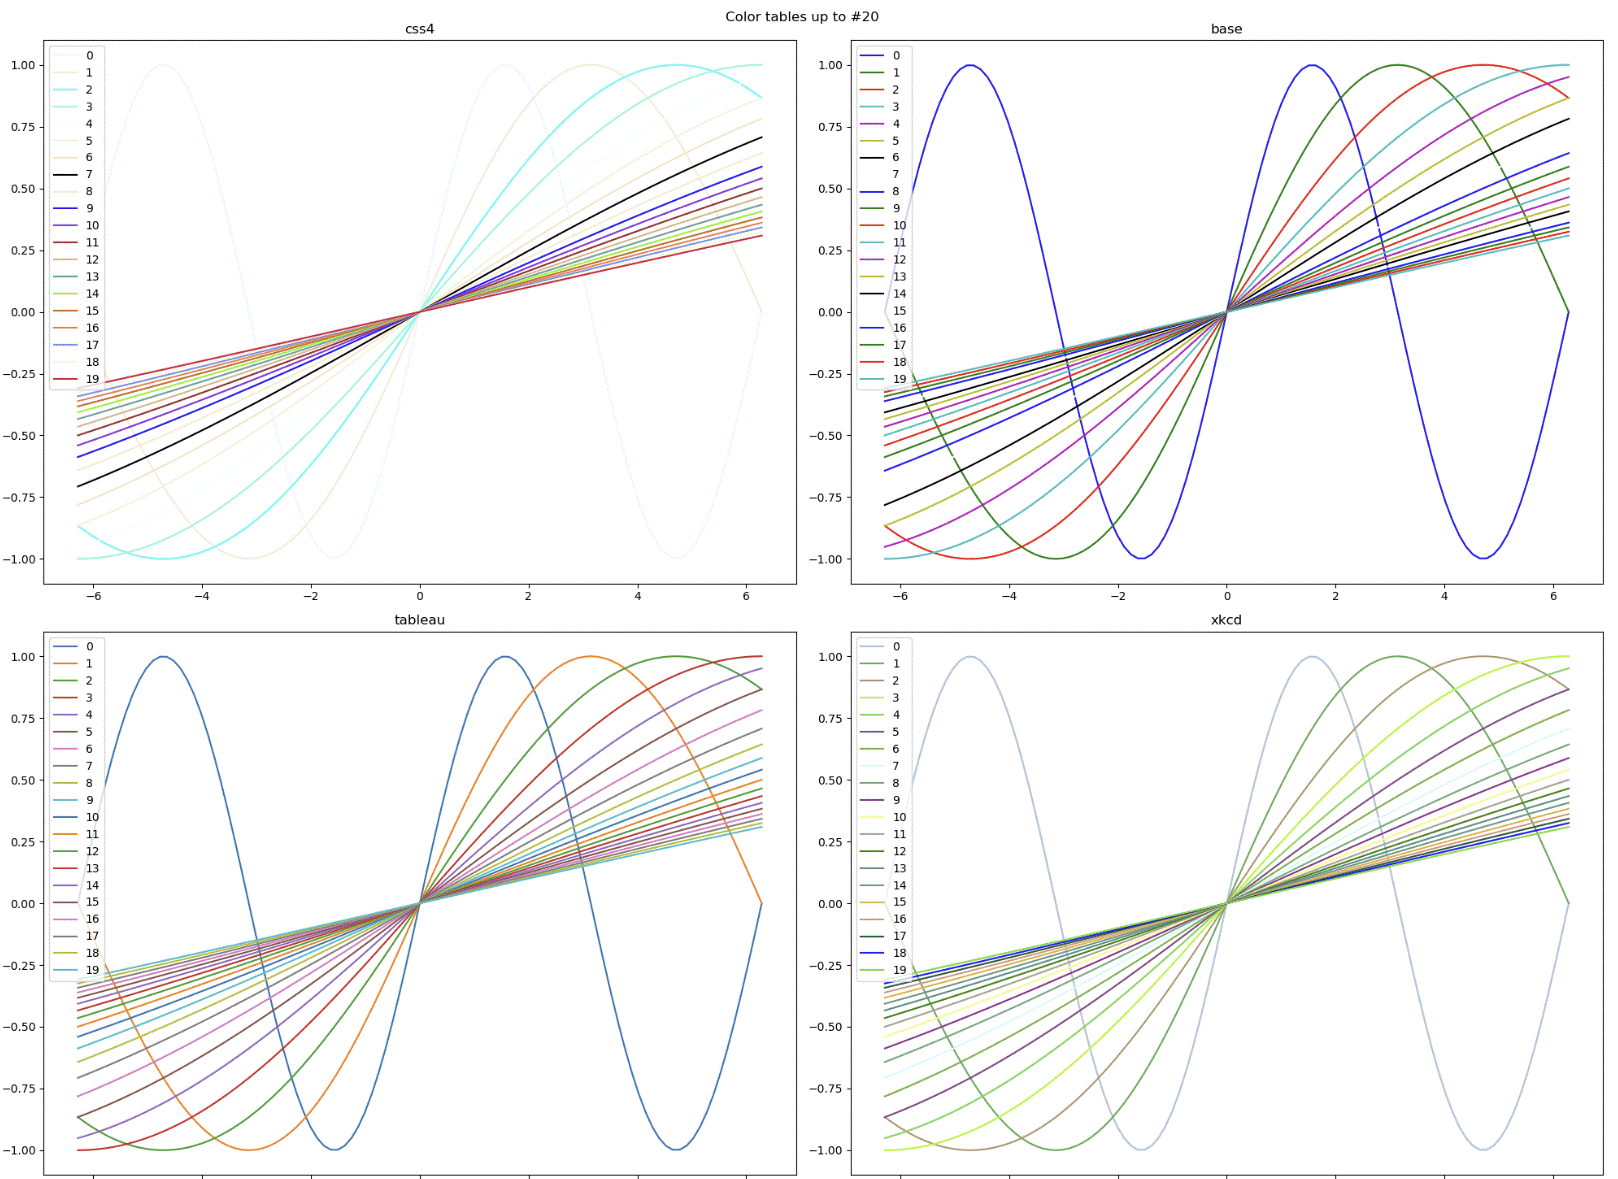
The classes cdxcore.dynaplot.colors_css4, cdxcore.dynaplot.colors_base, cdxcore.dynaplot.colors_tableau, cdxcore.dynaplot.colors_xkcd
are generators for the same colors.
Known Issues#
Some users reported that the package does not update figures consistently in some versions of Jupyter, in particular with VSCode.
In this case, please try changing the draw_mode parameter when calling cdxcore.dynaplot.figure().
Import#
from cdxcore.dynaplot import figure
Documentation#
Module Attributes
List of available colors names. |
Functions
|
Returns a color with a given index to allow consistent colouring. |
|
Returns the i'th base color: |
|
Returns the i'th css4 color: |
Returns the i'th tableau color: |
|
|
Returns the i th xkcd color. |
|
Returns a generator for the colors of the specified table. |
Iterator for "base" matplotlib colors: |
|
Iterator for "css4" matplotlib colors: |
|
Iterator for ""tableau"" matplotlib colors:" |
|
Iterator for xkcd matplotlib colors |
|
|
Creates a dynamic figure of type |
|
Returns a line from |
|
Computes |
|
Computes maximum of maxima. |
|
Computes minimum of minima. |
|
Creates a |
Classes
|
Deferred wrapper around a |
|
Deferred wrapper around |
|
Utility class to manage dynamic content by removing old graphical elements (instead of using element-specifc update). |
|
How to draw graphs. |
- class cdxcore.dynaplot.DynaAx(*, fig_id, fig_list, row, col, spec_pos, rect, title, projection, kwargs)[source]#
Bases:
_DynaDeferredDeferred wrapper around a
matplotlib.axes.Axesobjects returned bycdxcore.dynaplot.DynaFig.add_subplot()or similar.You should not need to know that this object is not actually a
matplotlib.axes.Axes. If you receive error messages which you do not understand, please contact the authors of this module.- auto_limits(low_quantile, high_quantile, min_length=10, lookback=None)[source]#
Add automatic limits using
cdxcore.dynalimits.AutoLimits.- Parameters:
- low_quantilefloat
Lower quantile to use for computing a ‘min’ y value. Set to 0 to use the actual ‘min’.
- high_quantilefloat
Higher quantile to use for computing a ‘min’ y value. Set to 1 to use the actual ‘max’.
- min_lengthint, optional
Minimum length data must have to use
numpy.quantile(). If less data is presented, use min/max, respectively. Default is10.- lookbackint
How many steps to lookback for any calculation.
Noneto use all steps.
- plot(*args, scalex=True, scaley=True, data=None, **kwargs)[source]#
Wrapper around
matplotlib.axes.Axes.plot().This function wrapper does not support the
datainterface ofmatplotlib.axes.Axes.plot().If automatic limits are not used, this is a wrapper with deferred pass-through. If automatic limits are used, then this function will update the underlying automated limits accordingly.
- Parameters:
- args, scalex, scaley, data, kwargs…
See
matplotlib.axes.plot().
- Returns:
- plot
Deferred This function will return a wrapper around an actual
axiswhich is used to defer actioning any subsequent calls to untilcdxcore.dynaplot.DynaFig.render()is called.You should not need to consider this. If you encounter problems in usability please contact the authors.
- plot
- remove()[source]#
Equivalent of
matplotlib.axes.Axes.remove(): removes this axis from the underlying figure. Note that this will not trigger a removal from the actual visualization untilcdxcore.dynaplot.DynaFig.render()is called.
- class cdxcore.dynaplot.DynaFig(title=None, *, row_size=5, col_size=4, fig_size=None, columns=5, tight=True, draw_mode=1, **fig_kwargs)[source]#
Bases:
_DynaDeferredDeferred wrapper around
matplotlib.figure.Figure.Provides a simple
cdxcore.dynaplot.DynaFig.add_subplot()without the need to pre-specify axes positions as is common formatplotlib.Construct elements of this class with
cdxcore.dynaplot.figure().- add_axes(rect, title=None, *, projection=None, **kwargs)[source]#
Add a freely placed sub plot.
Like
matplotlib.figure.Figure.add_axes()this function allows placing a plot at a given position within a figure usingrect. This plot may overlay previously generated plots.This function can be called after the
cdxcore.dynaplot.DynaFig.close()was called.Note that using this function with a
tightfigure will result in aUserWarning. Usetight=Falsewhen constructing your figure to avoid this warning.- Parameters:
- recttuple (left, bottom, width, height)
The dimensions (left, bottom, width, height) of the new plot. All quantities are in fractions of figure width and height.
- titlestr | None, default
None Title for the plot, or
Nonefor no plot.- projectionstr | None, default
None What
projectionto use. The defaultNonematches the default choice formatplotlib.figure.Figure.add_axes()- args, kwargs
keyword arguments to be passed to
matplotlib.figure.Figure.add_axes().
- Returns:
- Axis
cdxcore.dynaplot.DynaAx A wrapper around an matplotlib axis.
- Axis
- add_gridspec(ncols=1, nrows=1, **kwargs)[source]#
Wrapper for
matplotlib.figure.Figure.add_gridspec(), returning a deferedGridSpec.
- add_plot(title=None, *, new_row=None, spec_pos=None, projection=None, **kwargs)#
Adds a subplot.
Compared to
matplotlib.figure.Figure.add_subplot()this function does not require the tedious positioning arguments which are required when usingmatplotlib.figure.Figure.add_subplot(). This function also allows to directly specify a plot title.Implementation Comment:
This function returns a wrapper which defers the creation of the actual sub plot until
cdxcore.dynaplot.DynaFig.render()orcdxcore.dynaplot.DynaFig.close()is called.Thus this function cannot be called after
cdxcore.dynaplot.DynaFig.render()was called as then the geometry of the plots is set. Usecdxcore.dynaplot.DynaFig.add_axes()to draw plots at any time.- Parameters:
- titlestr | None, default
None Optional title for the plot.
- new_rowbool | None, default
None Whether to force a new row and place this plot in the first column. Default is
False.- spec_posgrid spec | None, default
None Grid spec position from
cdxcore.dynaplot.DynaFig.add_gridspec(), orNone.- projectionstr | None, default
None What
projectionto use. The defaultNonematches the default choice formatplotlib.figure.Figure.add_subplot().- kwargsdict
Other arguments to be passed to matplotlib’s
matplotlib.figure.Figure.add_subplot().
- titlestr | None, default
- Returns:
- Axis
cdxcore.dynaplot.DynaAx A wrapper around an matplotlib axis.
- Axis
- add_subplot(title=None, *, new_row=None, spec_pos=None, projection=None, **kwargs)[source]#
Adds a subplot.
Compared to
matplotlib.figure.Figure.add_subplot()this function does not require the tedious positioning arguments which are required when usingmatplotlib.figure.Figure.add_subplot(). This function also allows to directly specify a plot title.Implementation Comment:
This function returns a wrapper which defers the creation of the actual sub plot until
cdxcore.dynaplot.DynaFig.render()orcdxcore.dynaplot.DynaFig.close()is called.Thus this function cannot be called after
cdxcore.dynaplot.DynaFig.render()was called as then the geometry of the plots is set. Usecdxcore.dynaplot.DynaFig.add_axes()to draw plots at any time.- Parameters:
- titlestr | None, default
None Optional title for the plot.
- new_rowbool | None, default
None Whether to force a new row and place this plot in the first column. Default is
False.- spec_posgrid spec | None, default
None Grid spec position from
cdxcore.dynaplot.DynaFig.add_gridspec(), orNone.- projectionstr | None, default
None What
projectionto use. The defaultNonematches the default choice formatplotlib.figure.Figure.add_subplot().- kwargsdict
Other arguments to be passed to matplotlib’s
matplotlib.figure.Figure.add_subplot().
- titlestr | None, default
- Returns:
- Axis
cdxcore.dynaplot.DynaAx A wrapper around an matplotlib axis.
- Axis
- add_subplots(*titles, sharex=None, sharey=None, **kwargs)[source]#
Generate a number of sub-plots in one function call.
Use strings to generate subplots with such titles,
\nfor a new row, and integers to mass-generate a number of plots.Example:
from cdxcore.dynaplot import figure

with figure("Test", col_size=4, row_size=4) as fig:
    axA1, axA2, axB1, axB2 = fig.add_subplots("A1", "A2", "\n", "B1", "B2")
- Parameters:
- titleslist
A list if strings, integers,
\nand/orNone’s: a string generates a sub-plot with that title; an int generates as many subplots, and\nstarts a new row.Noneskips the entry. This is useful when creating conditional lists of sub-plots, e.g.:from cdxcore.dynaplot import figure with figure("Test", col_size=4, row_size=4) as fig: axA1, axA2, axB1, axB2 = fig.add_subplots("A1", "A2" if show2 else None, "\n", "B1", "B2" if show2 else None) if show2: assert not axA2 is None and not axB2 is None if not show2: assert axA2 is None and axB2 is None
Nonewill not create an empty slot; it will simply not generate the plot. To generate empty slots or span plots over several columsn or rows, usecdxcore.dynaplot.DynaFig.add_subplot()withgrid_spec.Note that the number of columns is usually limited by the
columnsparameter whencdxcore.dynaplot.figure()is called. You can setcolumnstoNoneto freely generate blocks of graphs.- sharexDynaAx | bool | None, default
None Can be used to share the x axis either with a specific axis, or with the first axis generated by this function call (
True). IfFalseorNonethis keyword has no effect.- shareyDynaAx | bool | None, default
None Can be used to share the y axis either with a specific axis, or with the first axis generated by this function call (
True). IfFalseorNonethis keyword has no effect.
- Returns:
- Sub-plots: tuple
A tuple of sub-plots, one for each
title.
- property axes: list[DynaAx]#
List of axes. Until
cdxcore.dynaplot.DynaFig.render()is called, these arecdxcore.dynaplot.DynaAxobjects; afterwards, these arematplotlib.axes.Axesobjects.
- close(render=True, clear=False)[source]#
Closes the figure.
Call this to avoid a duplicate in jupyter output cells. By dault this function will call
cdxcore.dynaplot.DynaFig.render()to draw the figure, and then close it.- Parameters:
- renderbool, default
True If
True, the default, this function will callcdxcore.dynaplot.DynaFig.render()and therefore renders the figure before closing the figure.- clearbool, default
False If
True, all axes will be cleared. This is experimental. The default isFalse.
- renderbool, default
- delaxes(ax, *, render=False)[source]#
Equivalent of
matplotlib.figure.Figure.delaxes(), but this function can also take a list.
- property hdisplay#
Returns the
IPython.display.DisplayHandlefor the current display, ifMODE.HDISPLAYwas used fordraw_modewhen the figure was constructed, and if the figure was rendered yet. Otherwise returnsNone.
- next_row()[source]#
Skip to next row.
The next plot generated by
cdxcore.dynaplot.DynaFig.add_subplot()will appears in the first column of the next row.
- remove_all_axes(*, render=False)[source]#
Calls
cdxcore.dynaplot.DynaAx.remove()for allcdxcore.dynaplot.DynaFig.axes
- render(draw=True)[source]#
Draw all axes.
If this function does not display the plots you generated, review the
draw_modeparameter provided tocdxcore.dynaplot.figure()orcdxcore.dynaplot.DynaFig(), respectively,Once called, no further plots can be added, but the plots can be updated in place.
- Parameters:
- drawbool, default
True If False, then the figure is created, but not drawn. You usually use
Falsewhen planning to usecdxcore.dynaplot.DynaFig.savefig()orcdxcore.dynaplot.DynaFig.to_bytes().
- drawbool, default
- savefig(fname, silent_close=True, **kwargs)[source]#
Saves the figure to a file.
Wrapper around
matplotlib.pyplot.savefig(). Essentially, this function writes the figure to a file rather than displaying itl.- Parameters:
- fnamestr
- silent_closebool, default
True If
True(the default), callcdxcore.dynaplot.DynaFig.close()once the figure was saved to disk. Unless the figure was drawn before, this means that the figure will not be displayed in jupyter, and subsequent activity is blocked.- kwargsdict
These arguments will be passed to
matplotlib.pyplot.savefig().
- static store()[source]#
Create a
cdxcore.dynaplot.FigStore. Such a store allows managing graphical elements (artists) dynamically. See the examples in the introduction.
- to_bytes(silent_close=True)[source]#
Convert figure to a byte stream.
This stream can be used to generate a IPython image using:
from IPython.display import Image, display
bytes = fig.to_bytes()
image = Image(data=byes)
display(image)
- Parameters:
- silent_closebool, default
True If
True, callcdxcore.dynaplot.DynaFig.close()after this genersating the byte streanm. Unless the figure was drawn before, this means that the figure will not be displayed in jupyter, and subsequent activity is blocked.
- silent_closebool, default
- Returns:
- imagebytes
Buyte stream of the image.
- class cdxcore.dynaplot.FigStore[source]#
Bases:
objectUtility class to manage dynamic content by removing old graphical elements (instead of using element-specifc update).
Allows implementing a fairly cheap dynamic pattern:
from cdxbasics.dynaplot import figure
import time as time

fig = figure()
ax = fig.add_subplot()
store = fig.store()

x = np.linspace(-2.,+2,21)

for i in range(10):
    store.remove()
    store += ax.plot( x, np.sin(x+float(i)) )
    fig.render()
    time.sleep(1)

fig.close()
As in the example above, the most convenient way to create a
FigStoreobject is to callcdxcore.dynaplot.DynaFig.store()on your figure.The above pattern is not speed or memory optimal. It is more efficient to modify the artist directly. While true, for most applications a somewhat rude cancel+replace is simpler.
FigStorewas introduced to facilitiate that.- add(element)[source]#
Add an element to the store. The same operation is available using
+=.- Parameters:
- element
matplotlib.artist.Artist Graphical matplot element derived from
matplotlib.artist.Artistsuch asmatplotlib.lines.Line2D; or aCollectionof the above; orNone.
- element
- Returns:
- self
Figstore Returns
self. This way compound statementsa.add(x).add(y).add(z)work.
- self
- clear()#
Removes all elements by calling their
matplotlib.artist.Artist.remove()function. Handles anyCollectionof such elements is as well.
- remove()[source]#
Removes all elements by calling their
matplotlib.artist.Artist.remove()function. Handles anyCollectionof such elements is as well.
- class cdxcore.dynaplot.MODE[source]#
Bases:
objectHow to draw graphs. The best mode depends on the output IPython implementation.
- CANVAS_DRAW = 4#
- CANVAS_IDLE = 2#
- DEFAULT = 1#
Setting which works for Jupyter lab and VSCode with
%matplotlib inlineas far as we can tell.
- HDISPLAY = 1#
- PLT_SHOW = 128#
Call
matplotlib.pyplot.show().
- cdxcore.dynaplot.color(i, table='css4')[source]#
Returns a color with a given index to allow consistent colouring.
- Parameters:
- iint
Integer number. Colors will be rotated.
- tablestr, default
css4 Which color table from matplotlib to use: “css4”, “base”, “tableau” or “xkcd”. Default is
"css4".
- Returns:
- Color codestr
- cdxcore.dynaplot.color_names = ['css4', 'base', 'tableau', 'xkcd']#
List of available colors names.
- cdxcore.dynaplot.color_xkcd(i)[source]#
Returns the i th xkcd color.
- cdxcore.dynaplot.colors(table='css4')[source]#
Returns a generator for the colors of the specified table.
- Parameters:
- tablestr, optional
Which color table from matplotlib.colors to use:
"css4","base","tableau", or"xkcd". Default is"css4".
- Returns:
- Generator for colors.
Use
next()or iterate.
- cdxcore.dynaplot.figure(title=None, *, row_size=5, col_size=4, fig_size=None, columns=5, tight=True, draw_mode=1, add_plots=None, **fig_kwargs)[source]#
Creates a dynamic figure of type
cdxcore.dynaplot.DynaFig.By default the
fig_sizeof the underlyingmatplotlib.figure.Figurewill be derived from the number of plots vscols,row_sizeandcol_sizeas(col_size* (N%col_num), row_size (N//col_num)).If
fig_sizeis specified thenrow_sizeandcol_sizeare ignored.Once the figure is constructed:
Use
cdxcore.dynaplot.DynaFig.add_subplot()to add plots (without the cumbersome need to know the number of plots in advance).Call
cdxcore.dynaplot.DynaFig.render()to place those plots.- Call
cdxcore.dynaplot.DynaFig.close()to close the figure and avoid duplicate copies in Jupyter. A convenient wrapper is to use
withto ensureclose()gets called.
- Call
Examples:
Simply use
cdxcore.dynaplot.DynaFig.add_subplot()without the matplotlib need to pre-specify axes positions:from cdxcore.dynaplot import figure with dynaplot.figure("Two plots") as fig: ax = fig.add_subplot("1") ax.plot(x,y) ax = fig.add_subplot("2") ax.plot(x,y)
Here is an example using
matplotlib.figure.Figure.add_gridspec():from cdxcore.dynaplot import figure with dynaplot.figure() as fig: gs = fig.add_gridspec(2,2) ax = fig.add_subplot( gs[:,0] ) ax.plot(x,y) ax = fig.add_subplot( gs[:,1] ) ax.plot(x,y)
Important Functions:
The returned
cdxcore.dynaplot.DynaFigwill defer all other function calls to the figure object untilcdxcore.dynaplot.DynaFig.render()orcdxcore.dynaplot.DynaFig.close()are called. Whenever you usewithat the end of the context windowcdxcore.dynaplot.DynaFig.close()will be called for you.The following direct members are important for using the framework:
cdxcore.dynaplot.DynaFig.add_subplot(): create a sub plot. No need to provide the customary rows, cols, and total number as this will computed for you.cdxcore.dynaplot.DynaFig.render(): draws the figure as it is. Call this function if the underlying graphs are modified as in the various example discussed here.cdxcore.dynaplot.DynaFig.close(): close the figure.If you do not call this function you will likely see duplicate copies of the figure in jupyter.
- Parameters:
- titlestr, default
None An optional title which will be passed to
matplotlib.pyplot.suptitle().- fig_sizetuple[int] | None, default
None By default the
fig_sizeof the underlyingmatplotlib.pyplot.figure()will be derived from the number of plots vscols,row_sizeandcol_sizeas(col_size* (N%col_num), row_size (N//col_num)).If
fig_sizeis specified thenrow_sizeandcol_sizeare ignored.- row_sizeint, default
5 Size for a row for matplot lib. Default is 5. This is ignored if
fig_sizeis specified.- col_sizeint, default
4 Size for a column for matplot lib. Default is 4. This is ignored if
fig_sizeis specified.- columnsint, default
5 How many columns to use when
cdxcore.dynaplot.DynaFig.add_subplot()is used. If omitted then the default is 5.- tightbool, default
True Short cut for
matplotlib.figure.Figure.set_tight_layout(). The default isTrue.Note that when
tightisTrueandcdxcore.dynaplot.DynaFig.add_axes()is called aUserWarningis generated. Turntightoff to avoid this.- draw_modeint, default
MODE.DEFAULT A combination of
cdxcore.dynaplot.MODEflags on how to draw plots once they were rendered. The required function call differs by IPython platform. The default,cdxcore.dynaplot.MODE.DEFAULTdraws well on Jupyter notebooks and in VSCode if%matplotlin inlineorwidgetis used. The latter requires the packagesipymplandipywidgets.Use the function
cdxcore.dynaplot.dynamic_backend()to set thewidgetmode if possible.- fig_kwargs
Other matplotlib parameters for
matplotlib.pyplot.figure()to create the figure.
- titlestr, default
- Returns:
- figure:
cdxcore.dynaplot.DynaFig A dynamic figure.
- figure:
- cdxcore.dynaplot.focus_line(left, right, N, *, concentration=0.9, power=2, focus=None, focus_on_grid=False, eps=1e-08, dtype=None)[source]#
Returns a line from
lefttorightwhich has more points infocus.This function computes a number of points on a line between
leftandrightsuch that points aroundfocusare more dense. Theconcentrationparameter allowws to blend between linear and focused points.The function is an appropriately scaled and shifted version of $x mapsto x (1-c) + c, x, mathrm{abs}(x)^{p-1}$ where $c$ is concentration.
- Parameters:
- left, rightfloat, float
Left hand and right hand points.
- Nint,
Number of points; must be at least 3.
- concentrationfloat, default
0.9 How much concentration: maximum is
1while0give a linear distibution of points.- focusfloat | None, default
None Focus point. If not provided, the mid-point is used.
- focus_on_gridbool, default
None Whether to place
focuson the grid.- dtypetype, default
None Numpy dtype.
- Returns:
- points
numpy.ndarray Numpy vector
- points
- cdxcore.dynaplot.m_o_m(*args, pos_floor=None, buf=0.05, min_dx=0.01)[source]#
Computes
cdxcore.dynaplot.min_o_min()andcdxcore.dynaplot.max_o_max()forargsto obtain their minimum of minima and maximum of maxima.This function is useful to compute arguments for
matplotlib.axes.Axes.set_xlim()ormatplotlib.axes.Axes.set_ylim().If
pos_floorisNonethen the function returns:dx = max( min_dx, max_ - min_ ) return min_ - dx*buf, max_dx*buf
If
pos_flooris notNone, then the function floorsmin_ - dx*bufatpos_floor.Usage:
from cdxcore.dynaplot import figure, m_o_m
import numpy as np

x = np.random.normal(size=(10,))
y = np.random.normal(size=(8,2))
z = [ np.random.normal(size=(3,2)), 0.1, None ]

with figure() as fig:
    ax = fig.add_subplot()
    ax.plot( x )
    ax.plot( y )
    ax.plot( z[1] )
    ax.set_ylim( *m_o_m(x,y,z, min_dx=0.01) )
- Returns:
- min, maxfloat | None, float | None
The adjusted minimum and maximum values as discussed above. The function returns
None, Noneifargsdoes not contain any numbers. Such result can be passed directly tomatplotlib.axes.Axes.set_xlim()ormatplotlib.axes.Axes.set_ylim()as both acceptNoneas default values.
- cdxcore.dynaplot.max_o_max(*args, default=None)[source]#
Computes maximum of maxima.
This function iterates through all arguments, and takes the maximum of all maxima. Parmaters can be numbers,
numpy.ndarrayarrays or lists of the former.This function is useful to compute arguments for
matplotlib.axes.Axes.set_xlim()ormatplotlib.axes.Axes.set_ylim().- Parameters:
- argslist[int | float | np.ndarray | None | list]
Numbers,
numpy.ndarrayarrays or lists of the former. Elements which areNoneare skipped.- defaultfloat | None, default
None Default value if
argswas empty.
- Returns:
- maxfloat | None
The maximum of all maxima, or
defaultif no elements were found.
- cdxcore.dynaplot.min_o_min(*args, default=None)[source]#
Computes minimum of minima.
This function iterates through all arguments, and takes the minimum of all minima. Parmaters can be numbers,
numpy.ndarrayarrays or lists of the former.This function is useful when calling
matplotlib.axes.Axes.set_xlim()ormatplotlib.axes.Axes.set_ylim().- Parameters:
- argslist[int | float | np.ndarray | None | list]
Numbers,
numpy.ndarrayarrays or lists of the former. Elements which areNoneare skipped.- defaultfloat | None, default
None Default value if
argswas empty.
- Returns:
- minfloat | None
The minimum of all minima, or
defaultif no elements were found.
- cdxcore.dynaplot.store()[source]#
Creates a
cdxcore.dynaplot.FigStorewhich can be used to dynamically update a figure.


